

In our previous Actionable Insights blog, we provided an overview of QAD Action Centers, our role-based dashboards featuring real-time actionable insights, and discussed the ways in which they differ from traditional Business Intelligence (BI) tools and key performance indicators (KPIs). Next we will look at the various predefined Action Centers made available by role, starting with the Chief Financial Officer (CFO) Action Center.
CFO Action Center Overview
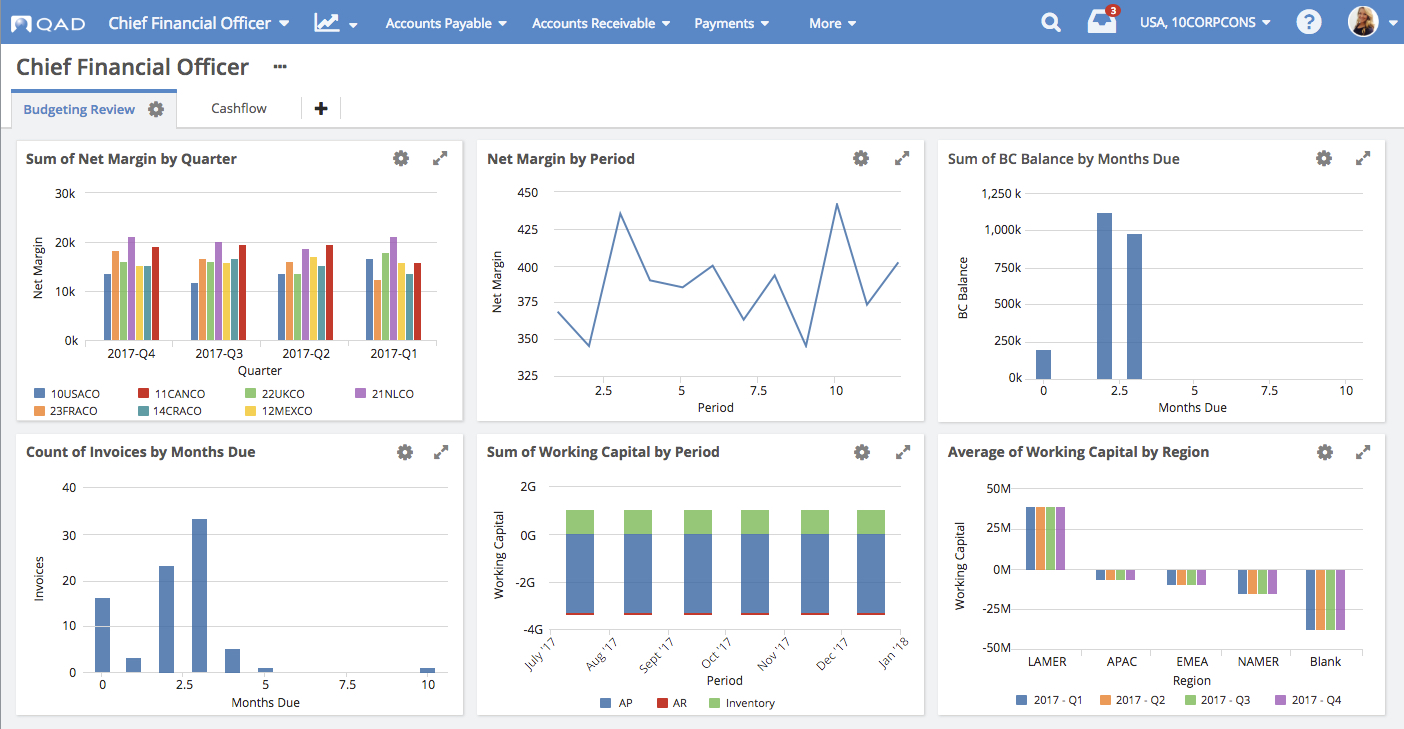
As with all the predefined QAD Action Centers, users can access the CFO Action Center from the Action Center and Dashboards menu. The CFO Action Center spans six areas, including financial analysis, revenue analysis and shipping and sales performance analysis. The results are always filtered by the viewer’s current workspace. This blog focuses specifically on the Financial Analysis KPIs.
KPIs for Financial Analysis
QAD Action Centers provide analytics to help managers and users to monitor metrics and KPIs. KPI highlights for the CFO Action Center include:
Margin % by Period
This allows users to visually see the margin net percentage by period or quarter, showing how profitable sales during the covered period have been. Most companies have a target margin that allows them to operate comfortably, and this KPI provides an early warning if margins have started to erode.
Margin by Period & Sub Account
The visual on this KPI allows users to examine margin by sub account within a period. Viewing by sub account can be extremely useful for monitoring product line margins, margin by facility or region, or many other variables depending on the way the company’s general ledger (GL) account structure is defined. Users have the option to select specific sub accounts for more detailed analyses.
Days Sales Outstanding by Period
Days sales outstanding (DSO) represents the average number of days it takes a company to collect revenue after a sale. A low DSO relative to the company’s industry means that the company is better at collecting cash. This may mean that customers are more satisfied and have fewer problems. It can also reflect more effective credit management and collections procedures. For more insight into DSO, check out this blog on the topic.
Working Capital by Quarter
Working capital is the difference between current assets and current liabilities-meaning cash or other assets that have not been earmarked for specific purposes and can be used in the short term. It measures the company’s financial health by representing the available operating liquidity. If working capital is too low, the company may not be able to invest in necessary maintenance or pay suppliers. Even payroll could be in jeopardy if funds get low enough. If working capital is too high, the company may achieve a better ROI by shifting some cash or short-term receivables to other uses. The user can select various combinations of assets and liabilities to validate the potential effect of proposed changes.
Days Payable Outstanding by Period
Days payable represents the average number of days a company takes to pay its trade debts. As such, it can provide insight into cash management and payment policies. If the days payable is much lower than other companies in the industry, it shows that the company pays its debts rapidly. While it’s good to pay on time, the company may be paying suppliers with money that could provide more ROI if used for other purposes, even if it’s only for a few days.
Cash Flow by Period
This metric shows the opening cash balance and cash activity by period. Using the indirect method for calculating sources and uses of funds, the analysis calculates changes in cash by measuring changes in cash, short-term assets, accounts receivable, accounts payable and any short-term debt payments due. As with most KPI visuals on the Action Centers, the user can decide what to include or omit with a single mouse click.
It is critical for any company to know and understand cash flow. There must be adequate cash on hand to meet operating expenses and payroll. If there is a short-term cash flow issue, the company may opt to cover it with a short-term loan or dip into a line of credit, or they may temporarily delay some payments. The important point is that knowing when a cash flow problem is coming allows the company to consider multiple strategies for handling the issue and then choose the best one. Without the required visibility, the company could be forced into less than optimum solutions, like high-interest loans or missing vitally important payments.
The Importance of Financial Analysis
A CFO is responsible for the financial health of an organization, but it is impossible to measure health without visibility into the current financial status and the trends in leading indicators, such as cash flow or DSO. By using the KPIs in Financial Analysis, the CFO has all the information necessary for sound fiscal policy.
QAD Financials ERP provides a complete solution for meeting the financial reporting and operational needs of most companies, including global multi-nationals, start-ups and divisions of large companies. The financial applications are IFRS compliant for use around the world and include flexible tax management, shared services support and a multi-company GL setup.
Which KPIs and metrics are most important to your organization? Learn more about QAD’s predefined Action Centers by role as well as best practices for each.


